Problem Solving
From asking SMART questions to addressing the root cause, my experience as a certified data analyst enhances my ability to understand the business problem, and work towards its proper resolution in a logical and efficient manner.
An Exceptional Data Analyst
Data has become a powerful tool for scaling a business or achieving a project's objective. As a result-oriented Data Analyst, I'm passionate about leveraging my technical expertise to drive business growth. I'm skilled in using Excel, SQL, R and Tableau to discover patterns and transform complex data into valuable insights that help businesses make effective decisions. This coupled with my exceptional communication and presentation skills ensure that I efficiently share findings in formats suitable for technical and non-technical stakeholders. Reach out today to explore how we can work together.

From asking SMART questions to addressing the root cause, my experience as a certified data analyst enhances my ability to understand the business problem, and work towards its proper resolution in a logical and efficient manner.
With years of work experience in the public and private sector, leading teams and collaborating on projects, I have honed the ability to share my findings effectively and concisely in the manner most suitable for my audience.
Seeing the big-picture and being detail-oriented, I approach problems with curiosity, creativity and a technical mindset. This ensures that I understand the context and apply data design and strategy towards identifying, describing and solving business problems.
I have successfully collaborated with diverse teams to identify key business challenges and deliver actionable recommendations. My experience working with various groups and individuals drives my committment towards achieving shared objectives.

Data Exploration with SQL; What country was proactive in implementing COVID mitigation measures? I explored key COVID metrics to extract insights that reveal this and more.

Visualizing commuting trends in R; How did travel to work change between the last two censuses in Southampton? I compared this to reveal the wards with highest work commuters.

Data Cleaning in SQL; How do you find and populate key missing fields in housing data? Or reproduce a clean version of the data for analysis? Let’s do this with SQL.

Prescriptive Analysis in R; Which country makes the highest-rated super dark chocolate bars? We uncover this and more from Chocolate Ratings data.

Visualizing Business Data in Excel; Data is the lifeblood of a modern business. Let’s create sales, customer and product dashboards for business optimization.
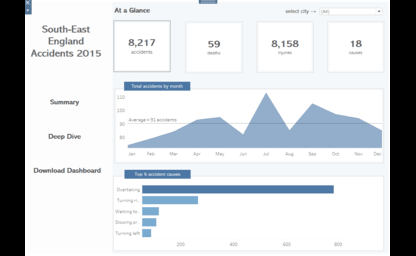
Visualizing Data in Tableau; Explore this detailed six page dashboard analysis on key metrics for vehicle accidents within six cities in South East England.